top of page


PROJECT CONTROLLING WITH MS POWER BI
Configure Primavera P6 Oracle with MS Power BI


-
Immediate Group & Sorting
-
Quick Filtration
-
Quick Search ( Task/Resource)
-
Critical Path Analysis
-
Baseline Schedule Comparison
-
Float Path
-
Resource Histogram
-
Project S-curve
-
Periodic Updates
-
EVM - PV,EV,AC,SPI,CPI


-
Switch Between Multiple Baselines
-
Filter Project Easily
-
Earn Value analysis
-
Cost Distribution Analysis
-
Resource Distribution Analysis
-
Forecast Analysis
-
Resource Histogram
-
Project S-curve
-
Date Variances Analysis

KPI's Dashboard
-
BEI Finish : # Task Completed / # Task Planned to be Completed
-
CPLI : Critical Path Length + Critical Path Total Float / Critical Path Length
-
TFCI : Actual duration + Critical Path total Float / Actual Duration
-
Predicted CPTF = PD x (TFCI -1)
-
ECD(tfci) : PF - Predicted CPTF
-
TSPI : (PD - ES) / (PD - AT) Time planned to go from Current PV to BAC / Time forecasting to do it in
-
Time Estimate at Completion[TEAC] = SAC / TPI
-
Time Variance at Completion[TVAC] = SAC - TEAC


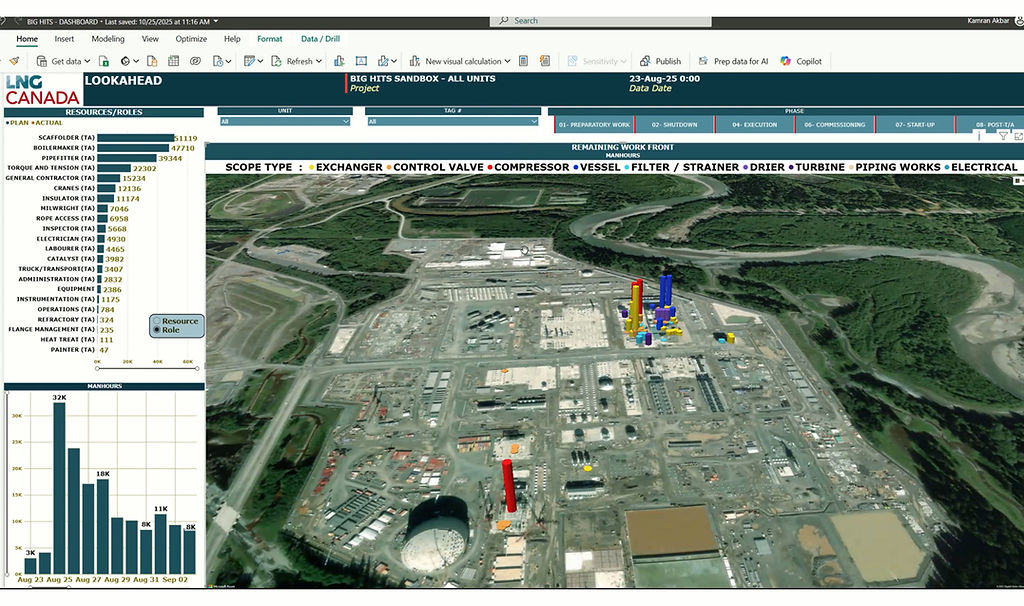
LOOKAHEAD WORKFRONT
-
Geographical Reporting
-
Bird Eye Review
-
One Page Forecasting Analysis
-
Resource Allocation Analysis
-
Lookahead Workfront
-
User friendly filtration
-
Single Click Review

contact
CONTACT US
bottom of page